Unlocking the Power of Spatial Analysis With Map Charts
Understanding and analyzing trends within the increasingly data-saturated environment of modern business can be a daunting task. However, utilizing spatial analysis and visualization techniques can effectively simplify this process and turn seemingly nebulous data into comprehensive insights. One approach to spatial investigation that is growing in popularity and proven effectiveness for data visualization is the use of map charts. Below we delve into the remarkable benefits and practical applications.
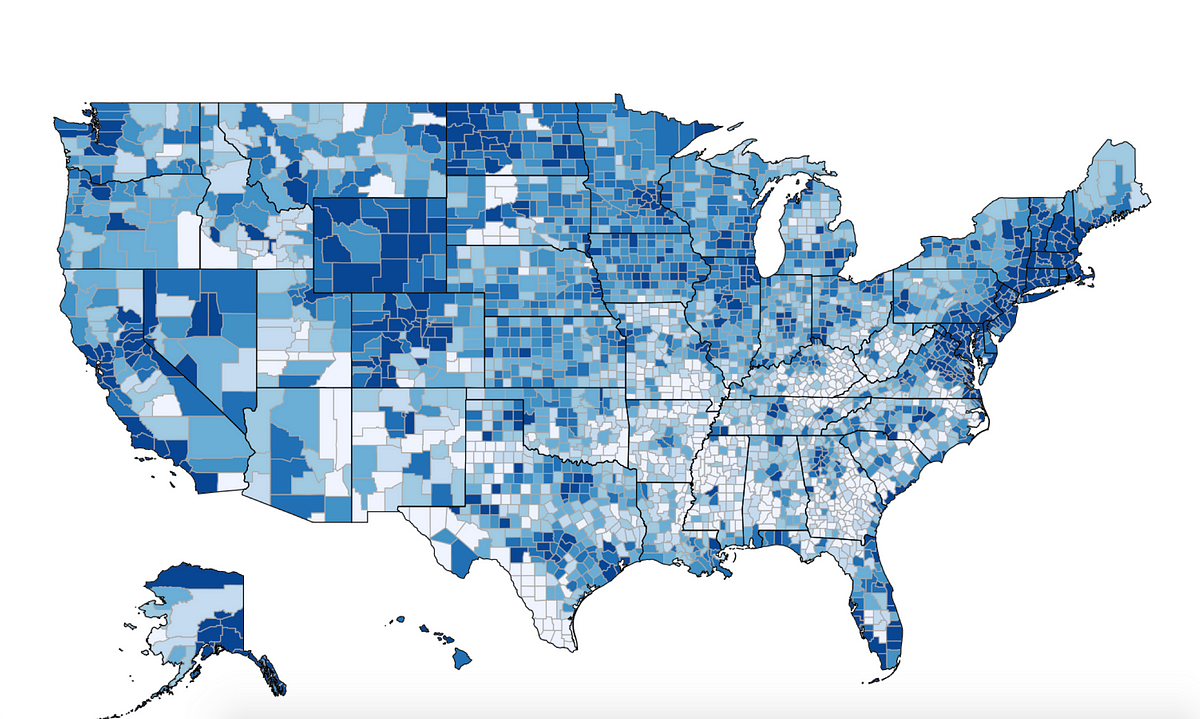
Understanding the Concept of Spatial Analysis
Alt text: Man sitting at his work desk while on his computer and using a map chart.
Spatial analysis is a type of geographical analysis that involves examining spatial patterns to understand correlations or anomalies within data. It is a multi-faceted process that equips researchers and businesses to extract and present data in a way that adds new dimensions to understanding patterns and trends.
The power of spatial analysis emerges not just from isolating data points but understanding their relative positions. The method allows us to see the invisible thread weaving them together, to identify clusters and outliers that traditional statistical analysis may overlook.
By utilizing location-specific data, spatial analysis can provide predictive and meaningful insights that drive strategic decision-making. It is used across a wide range of industries, including environmental management, public health, crime mapping, and retail location analysis.
Although a complex discipline, modern technology has made spatial analysis readily accessible for business and industry usage. One of the most effective tools in this regard is map charts.
The Significance of Map Charts in Data Visualization
Data visualization refers to the portrayal of data in a graphical or pictorial format. It allows for a clear understanding of the complex data, making it a vital tool in the field of spatial analysis. When it comes to regional or location-specific data, map charts are the go-to form of visual representation.
Map charts represent various geographical regions and can be customized to depict specific phenomena. They can portray anything from population data and temperature trends to sales volume in different regions. By bringing visual clarity to data, map charts enable better business decisions.
They are particularly useful for visualizing location-based datasets and trends, which is invaluable for businesses such as logistics, transportation, and retail. The maps provide a clear overview of geographical distribution, cluster identification, and trend detection.
Whether it’s identifying potential markets, optimizing delivery routes, or performing risk assessment, the contribution of map charts in spatial analysis is significant and multifaceted.
Real-World Applications of Spatial Analysis With Map Charts
Spatial Analysis with map charts can be utilized to great effect across a wide range of industries and applications. For instance, in the field of environmental management, they can visualize geographically influenced data such as pollution levels, and climate change patterns.
Businesses can leverage map charts for location analysis, customer segmentation, and competitor analysis. Whether it’s pinpointing the regions with the highest sales potential or identifying neglected market segments, map charts offer a high degree of dynamic insight.
From transportation and logistics to retail and real estate, the applications of spatial analysis with map charts are vast, contributing to the optimization and success of business strategies.
Benefits of Integrating Spatial Analysis Into Your Business Strategy
Integrating spatial analysis into your business strategy can offer myriad benefits. It can enhance the understanding of customer patterns and behavior, uncover trends and opportunities, and provide actionable insights to drive growth.
By visualizing data using map charts, businesses gain a more comprehensive picture, making data actionable and decision-making more logical. The capability to understand the geographic distribution of clients and maintain spatial relationships significantly impacts marketing approaches, risk management, and operational planning.
Challenges and Solutions in Implementing Map Charts for Spatial Analysis
Alt text: Man sitting at his work desk while staring at a large monitor that features a map chart.
While integrating spatial analysis and map charts into business strategy can be transformative, it’s not without its challenges. Maintaining data privacy, ensuring the accuracy of spatial data, coping with large volumes of data, and the need for trained personnel can pose difficulties.
Accuracy of spatial data is another concern. Data should be regularly updated and cross-verified to ensure correctness. Employing auto-updating databases, systematic data collection and validation techniques can help overcome this hurdle.
Overall, the incorporation of spatial analysis using map charts into modern business strategy offers powerful insights and a significantly optimized decision-making framework.